> ## Documentation Index
> Fetch the complete documentation index at: https://docs.visual-layer.com/llms.txt
> Use this file to discover all available pages before exploring further.
# What is Visual Layer?
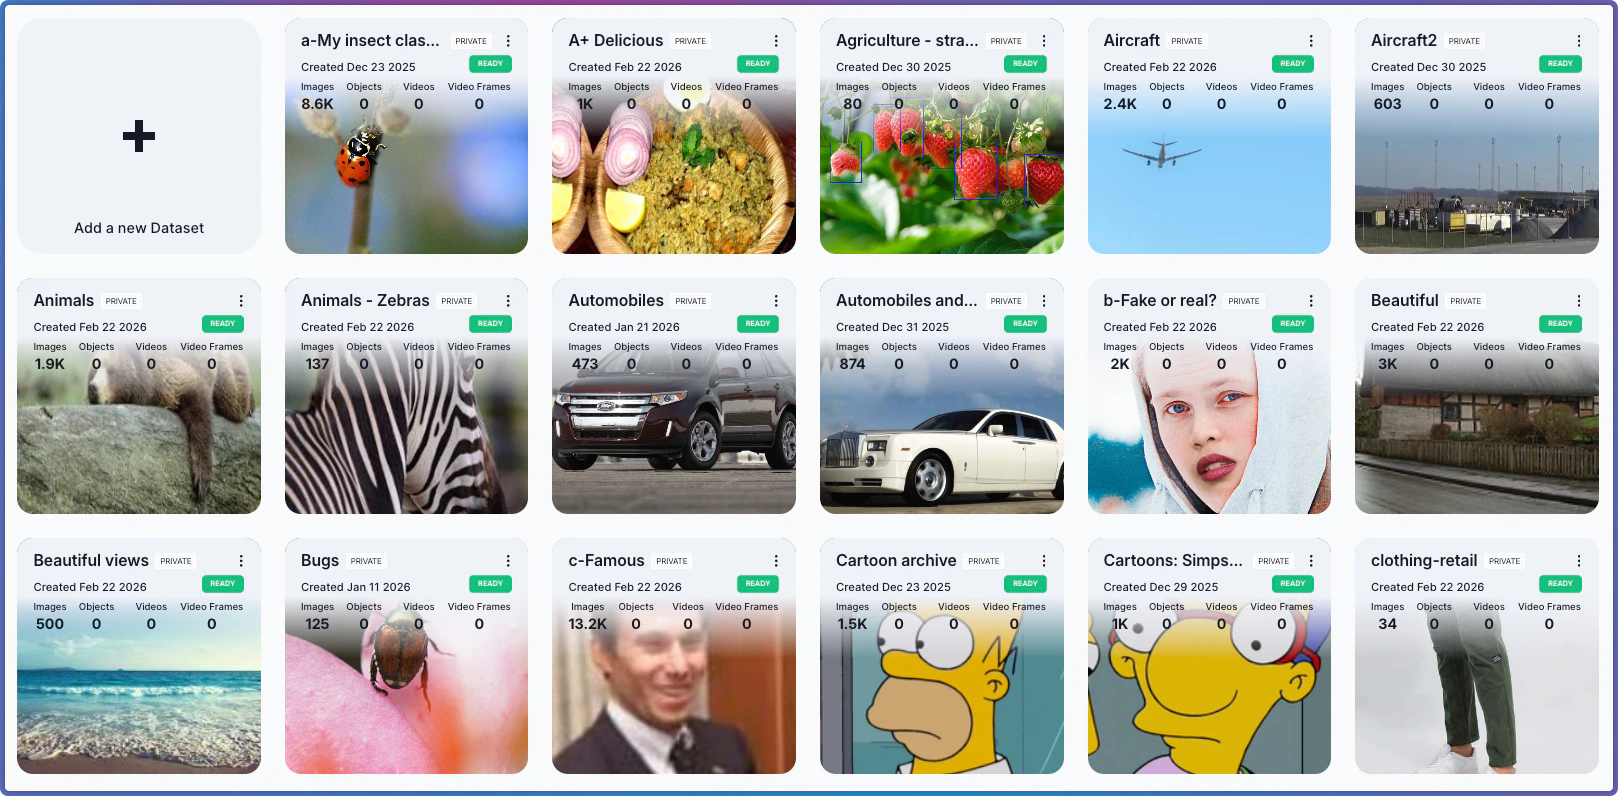
Visual Layer is a platform for managing and analyzing visual datasets at scale.
When you work with large collections of images and videos, Visual Layer helps you find specific content, identify quality issues, and organize data efficiently. Your visual data provides the foundation for Visual Layer to generate insights, detect patterns, and streamline curation workflows.
 ## What makes Visual Layer efficient for visual data management and analysis?
Visual Layer provides three core capabilities for managing visual datasets.
### Exploring visual datasets
Visual Layer organizes your data into clusters of similar images and objects. [Semantic Search](/docs/explore-and-search/semantic-search) finds content using natural language descriptions like "cat sitting on a fence." [Visual Search](/docs/explore-and-search/visual-search) locates similar images based on reference examples you provide.
### Improving data quality
Visual Layer identifies duplicates, outliers, and quality issues automatically. [Duplicate Detection](/docs/explore-and-search/filtering-overview) finds redundant frames that waste storage and bias models. [Quality filters](/docs/explore-and-search/filtering-overview) surface technical problems like blur, overexposure, or underexposure that reduce annotation accuracy.
### Organizing and collaborating
Visual Layer saves your filtering queries as reusable views. [Saved Views](/docs/collab-and-downstream/share-dataset) let teams access specific dataset subsets instantly without recreating searches. Metadata management adds custom tags and attributes for better organization and downstream workflows.
## Get started with Visual Layer
Select any of the following to begin.
Upload and index your first visual dataset
Choose between cloud and self-hosted deployment
Learn core terminology and platform concepts
## What makes Visual Layer efficient for visual data management and analysis?
Visual Layer provides three core capabilities for managing visual datasets.
### Exploring visual datasets
Visual Layer organizes your data into clusters of similar images and objects. [Semantic Search](/docs/explore-and-search/semantic-search) finds content using natural language descriptions like "cat sitting on a fence." [Visual Search](/docs/explore-and-search/visual-search) locates similar images based on reference examples you provide.
### Improving data quality
Visual Layer identifies duplicates, outliers, and quality issues automatically. [Duplicate Detection](/docs/explore-and-search/filtering-overview) finds redundant frames that waste storage and bias models. [Quality filters](/docs/explore-and-search/filtering-overview) surface technical problems like blur, overexposure, or underexposure that reduce annotation accuracy.
### Organizing and collaborating
Visual Layer saves your filtering queries as reusable views. [Saved Views](/docs/collab-and-downstream/share-dataset) let teams access specific dataset subsets instantly without recreating searches. Metadata management adds custom tags and attributes for better organization and downstream workflows.
## Get started with Visual Layer
Select any of the following to begin.
Upload and index your first visual dataset
Choose between cloud and self-hosted deployment
Learn core terminology and platform concepts