
Overview
For visualizing the results or individual parts of the analysis, fastdup generates galleries in the form ofHTML files that are saved to the galleries sub-dir of the work directory and presented interactively when using Jupyter notebooks.
Starting from V1.0 galleries have a new layer of abstraction that automatically adds bounding boxes and labels to images where available.
Supported galleries
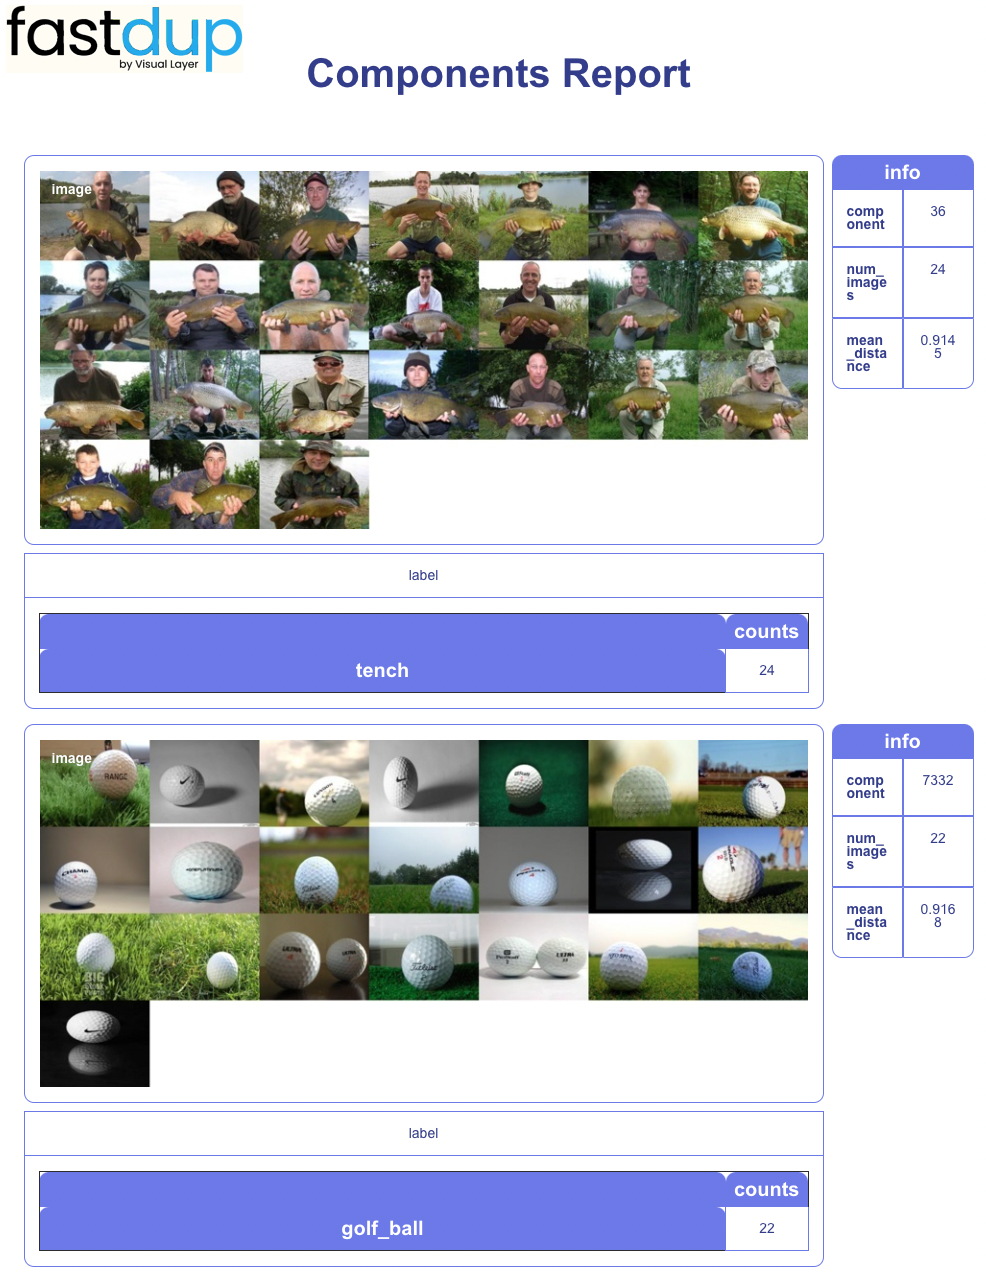
Components: Fastdup.vis.component_gallery
Duplicates: Fastdup.vis.duplicates_gallery

Outliers: Fastdup.vis.outliers_gallery
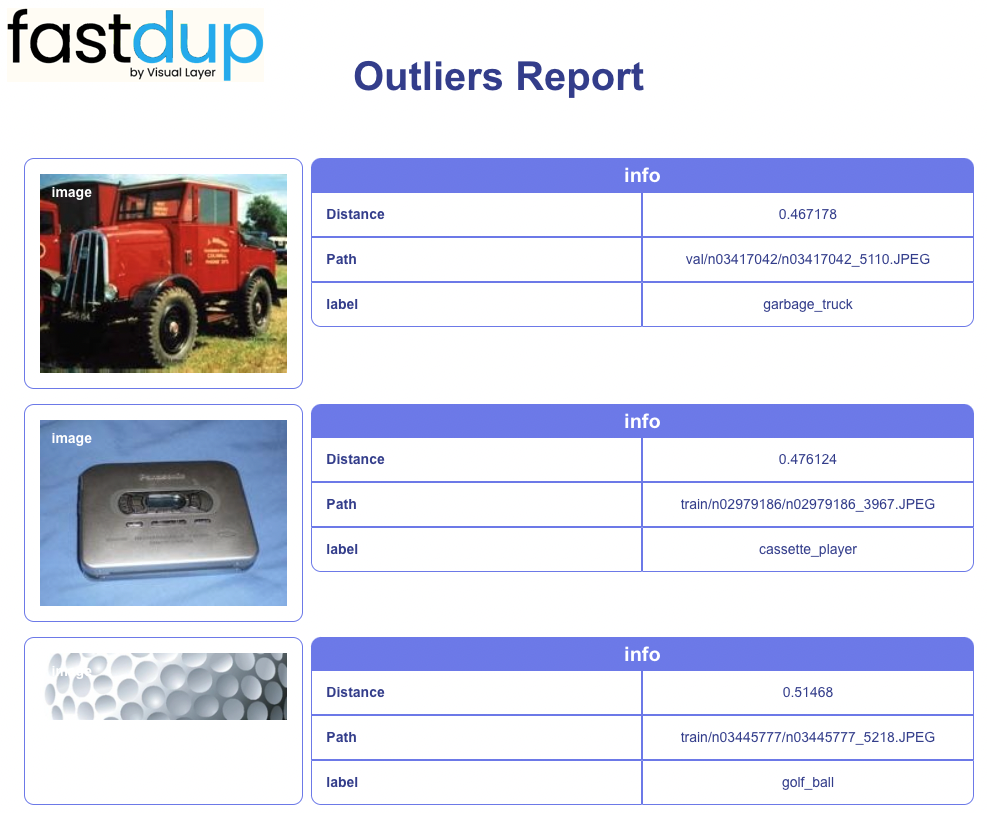
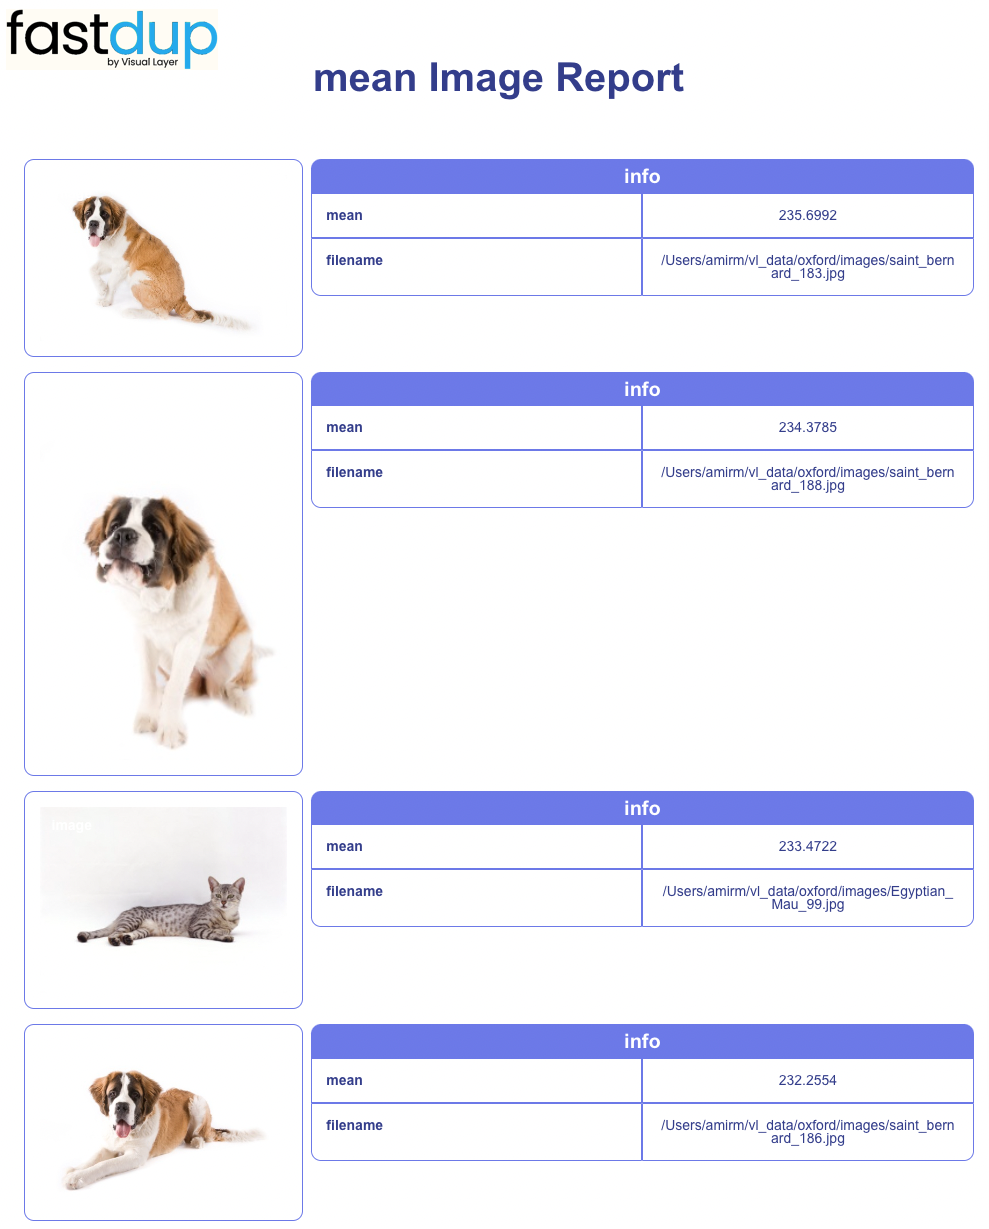
Image statistics: Fastdup.vis.stats_gallery
Similarity: Fastdup.vis.similarity_gallery

For more detail, see Galleries API Reference
Gallery configuration
Galleries share a few methods and arguments used for visualizing labels and bounding boxes, and for setting general attributes:-
slice: Visualize a subset of the data with the given label, e.g.,slice='dog' -
sort_by: Sort images by a property, supported are:- default:
comp_size- Number of images in the component distance- The average distance between cluster members. Clusters where the images are most similar will be presented firstarea- From the largest to the smallest image or bounding box average size
- default:
-
label_col: Column to use as labels, common options arelabel,splitandimg_filename. -
num_images: (default=20) The number of images to visualize. -
max_width: (default=None) Pixel width of displayed gallery. Useful values are often in the 800-1200 range. -
lazy_load: (default=False) WhenFalse, images are embedded into the galleryHTMLfiles. Otherwise images are loaded by the browser using their relative paths. Usinglazy_loadmakes galleries lighter and faster to generate, but less portable and shareable. On the other hand, Without lazy loading galleries become very large files.
Visualizing Images
For most cases, visualization is as simple asfd.vis.component_gallery(). The rest of the parameters are optional, and could be selected in hindsight.
Adding Labels
Thelabel_col argument controls the labels appended to each image visualized. By default it fetches labels from the label column in the annotations dataframes provided during the fastdup.run() call. When labels are not provided, or if the use of another column is desired, the label_col argument could be set for using the required column.