
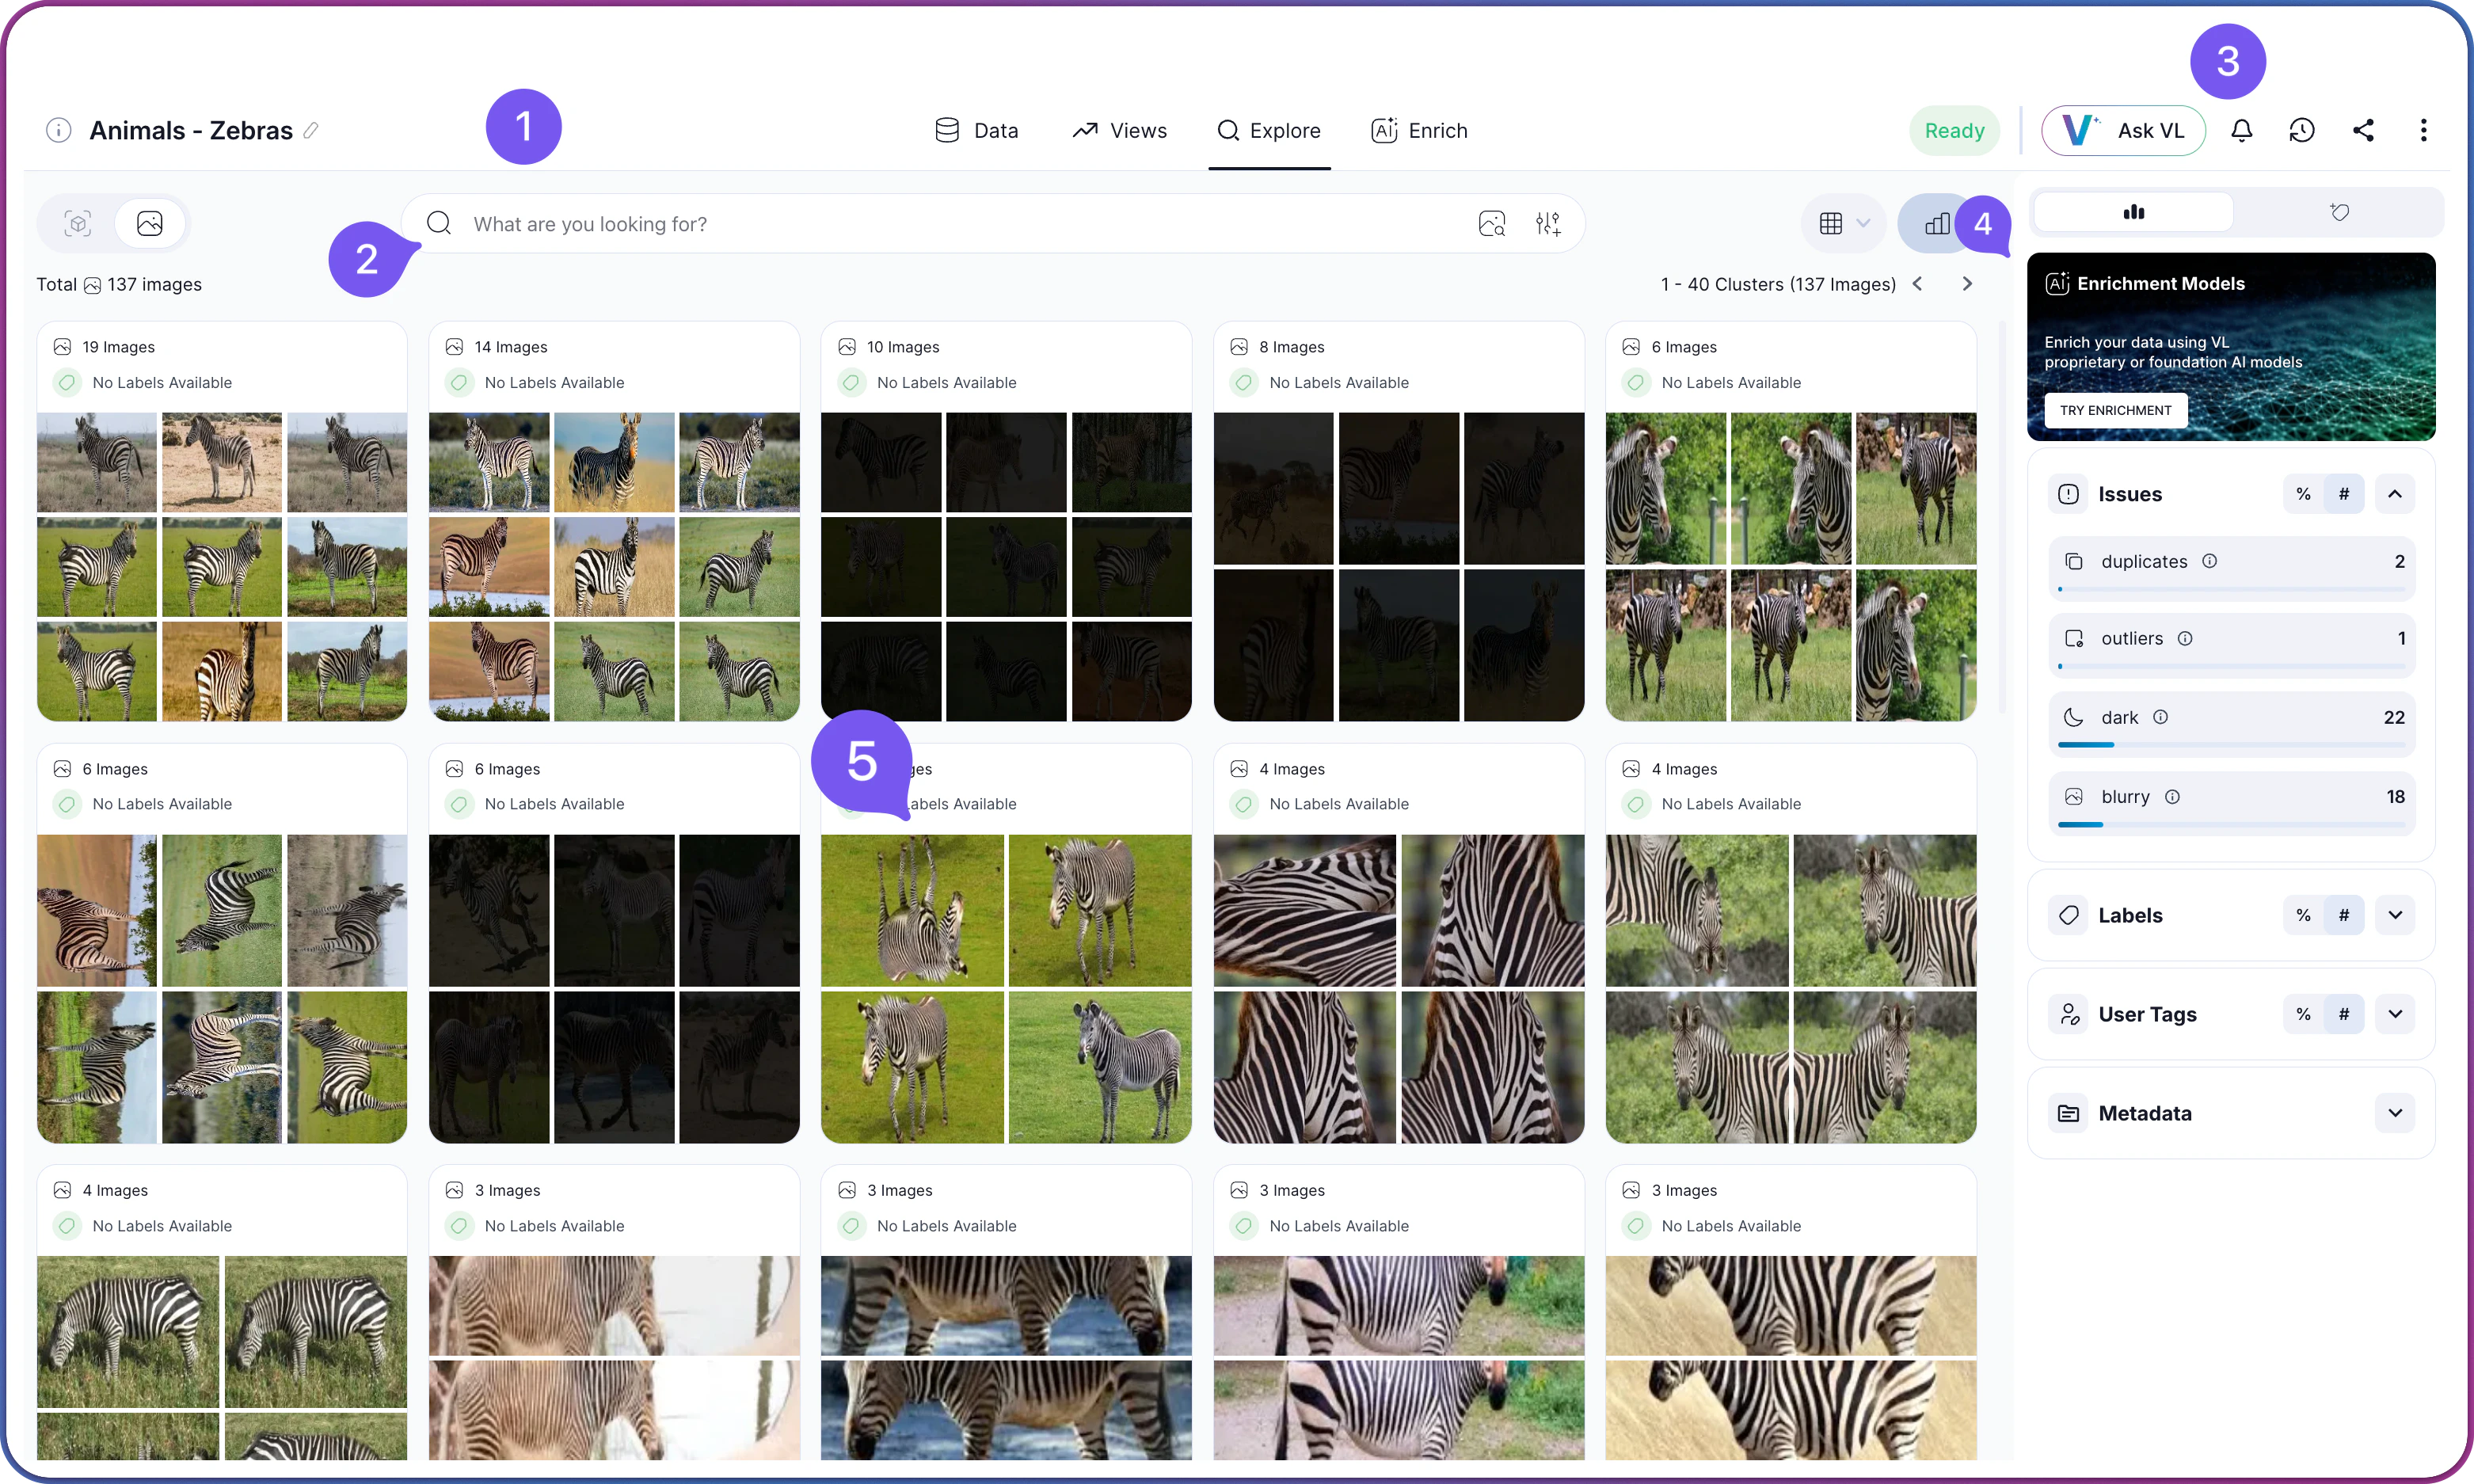
Interface Layout
Once you are inside a dataset, the exploration interface loads with five main areas:| Area | Component | Description |
|---|---|---|
 | Navigation Tabs | Switch between Explore, Data, and Views |
 | Filter Panel | Apply and combine search criteria to narrow your dataset |
 | Action Bar | Access operations like export, share, and selected items management |
 | Insights Panel | View metadata, insights, statistics, and access enrichment features |
 | Content Grid | Visual representation of your data in clusters, images, or objects |
Navigation Tabs
Three tabs organize your workflow when working with a dataset:| Tab | Purpose | Use Cases |
|---|---|---|
| Explore | The workspace for viewing and analyzing dataset content. All search, filtering, cluster navigation, and quality analysis happen here. | Browse clusters, run semantic or visual searches, apply filters, identify quality issues, make selections |
| Data | The dataset’s setup and status page. Shows the creation checklist (data source, annotations, index type, upload, indexing), a preview of the uploaded media, and an activity log. | Confirm dataset creation completed, preview the uploaded media, review activity history |
| Views | Saved combinations of filters and search queries. | Reload a previously defined exploration, share analysis criteria with your team |
Exploration Workflow
Effective dataset curation typically involves a multi-step process rather than a single query. These steps explain how to combine Visual Layer’s tools to move from broad discovery to a precise, curated selection.Find: Discover Relevant Content
Start by casting a wide net to locate potential candidates.
- Use Semantic Search for conceptual queries (e.g., “damaged packaging” or “outdoor crowd”).
- Use Cluster Navigation to browse high-level patterns without a specific query.
- Use Visual Search with an external image upload to find matches for a reference asset.
Narrow: Refine Your Results
Filter out irrelevant matches to focus on your specific criteria.
- Apply Visual Similarity on a specific search result. Crop a region (e.g., just the defect, not the background) to narrow the search visually.
- Add Metadata Filters (Folders, Labels, Dates) to restrict the search scope to relevant batches or sources.
Refine: Identify Distinctive Content
Ensure your selection represents the diversity of your data, not just the most common examples.
- Apply the Uniques Filter to hide repetitive content. Increasing the threshold surfaces only visually distinct items, covering edge cases and varied angles rather than just the average.
- Check Outliers to find rare examples or anomalies that might be missing from the main clusters.
Clean: Remove Redundancy and Issues
Polish the collection before finalizing.
- Review Duplicates to select single representative frames from burst sequences or near-identical backups.
- Filter Quality Issues (blur, dark, bright) to automatically exclude unusable or low-quality assets.
Organize: Save and Share
Preserve your work for the team.
- Save as View to capture the full combination of search queries, filters, and thresholds. Team members can access the dynamic collection without rebuilding the logic.
- Export the selection to JSON or CSV for downstream training or annotation workflows.
Related Resources
How to Search & Filter
Step-by-step guide to running searches and filters, plus the full list of available options.
How Search Works
Concepts behind semantic search and visual similarity
Visual Search
Find similar images using visual embeddings
Understanding Clusters
How Visual Layer organizes images