
- Track incoming data quality by watching for new duplicates, outliers, or mislabeled items.
- Detect shifts in data distribution when new batches consistently match certain filter criteria.
- Coordinate team review by alerting all dataset collaborators when relevant new data arrives.
- Build a historical record of how result counts evolve across successive data additions.
How Monitoring Works
Monitoring is enabled by default when a saved view is created. The system records amonitoring_started_at timestamp and begins tracking results from that point forward.
The evaluation cycle runs automatically after each media batch completes processing:
1
New media arrives
New media is added to the dataset through the Add Media API or the UI.
2
Pipeline processes the batch
The pipeline indexes, embeds, and clusters the incoming media.
3
Monitored views are evaluated
After processing completes, the system evaluates every monitored view for that dataset.
4
Matches are counted
For each view, the system counts how many items in the new batch match the view filter criteria.
5
Trend data is recorded
The result count and timestamp are recorded as a data point in the view trend history.
Monitoring evaluates only new batches that arrive after the view was created. Historical data added before the view existed is not retroactively evaluated.
Trend Data
Each evaluation produces a data point containing the batch timestamp and the number of matching items. These data points accumulate into a trend history visible in the Views tab. The expanded view row displays a Trend Results bar chart on the left side, showing the last 8 data points with timestamps and counts. Hover over any bar to see the exact date and result count.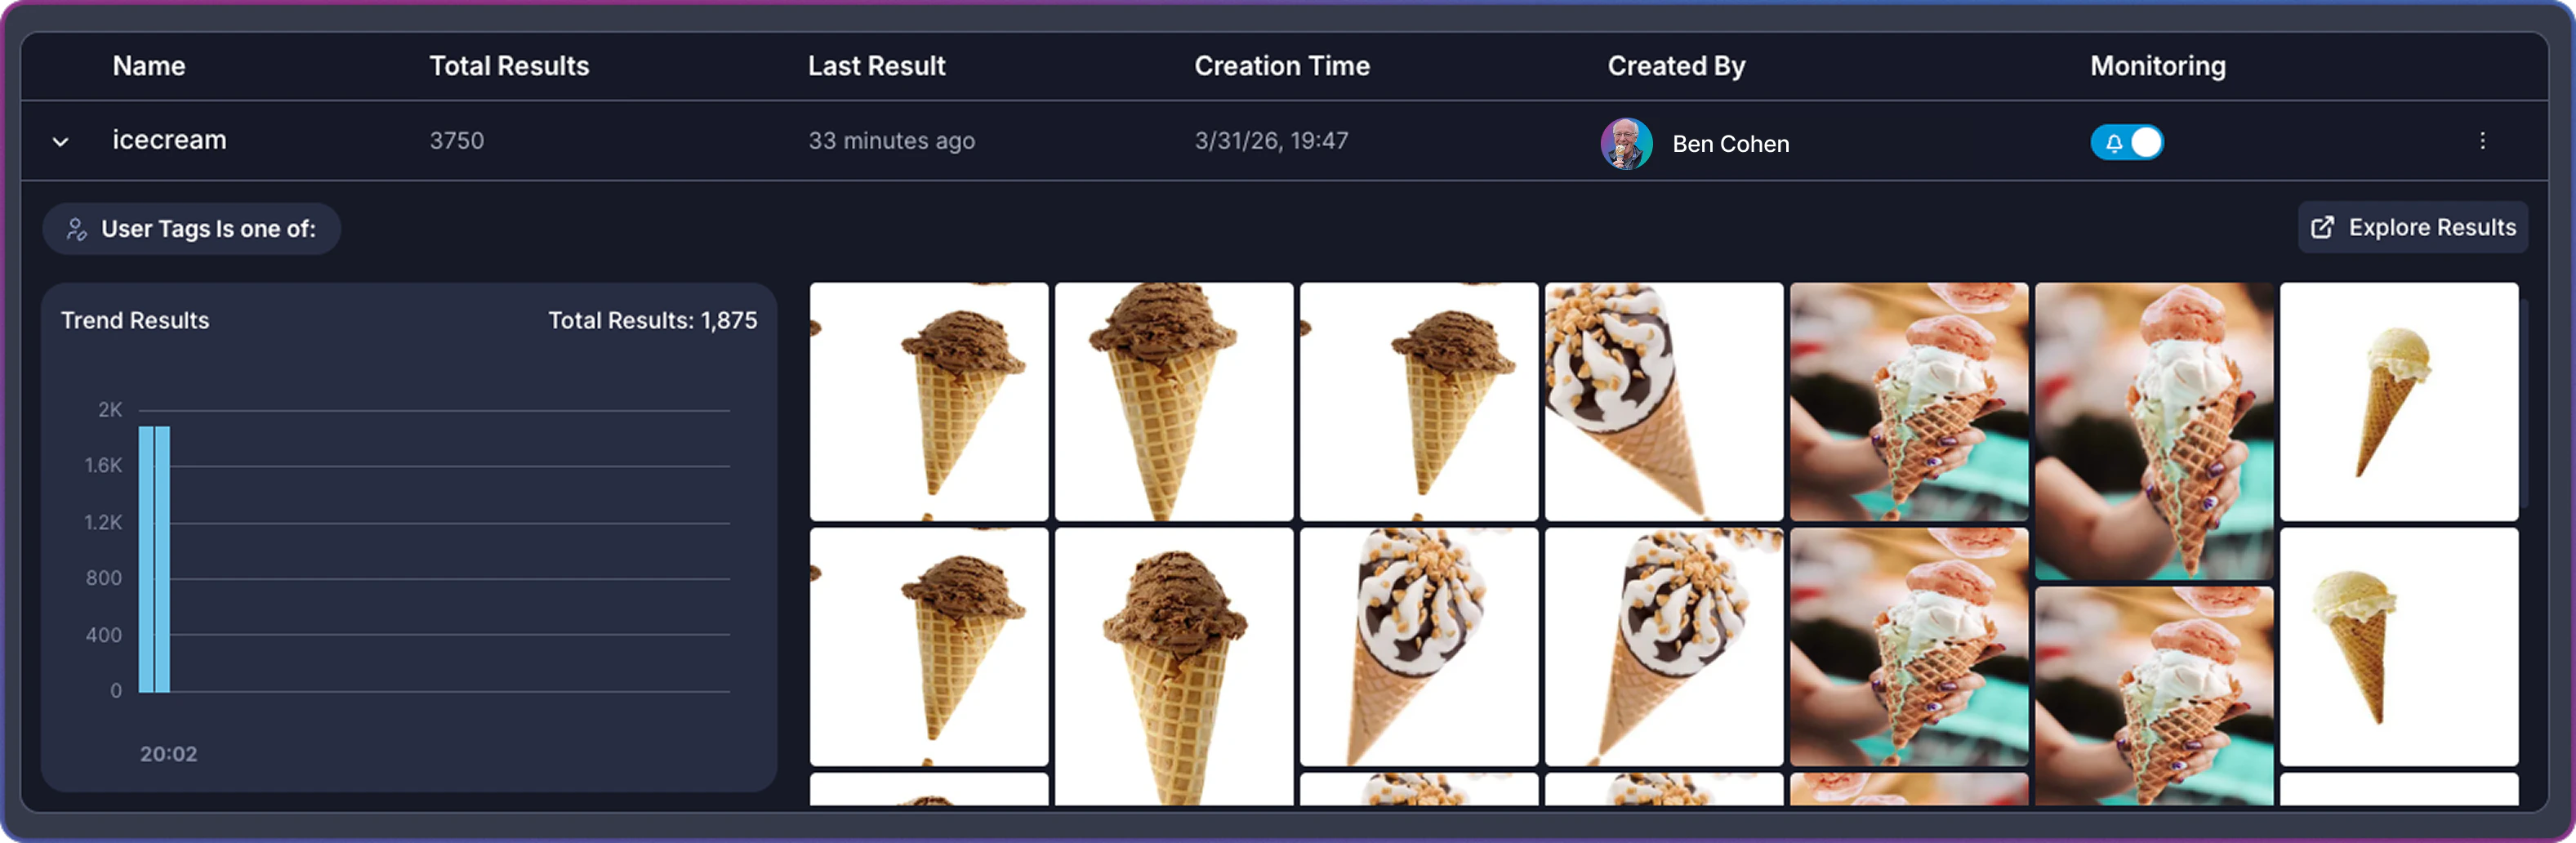
Enabling and Disabling Alerts
Monitoring runs automatically on all saved views, but alerts are controlled separately through the Monitoring toggle in the Views tab. Enabling alerts means you receive a notification whenever a batch evaluation finds new matching results for that view.- Navigate to the Views tab from the dataset header.
- Locate the view in the table.
- Click the toggle in the Monitoring column.
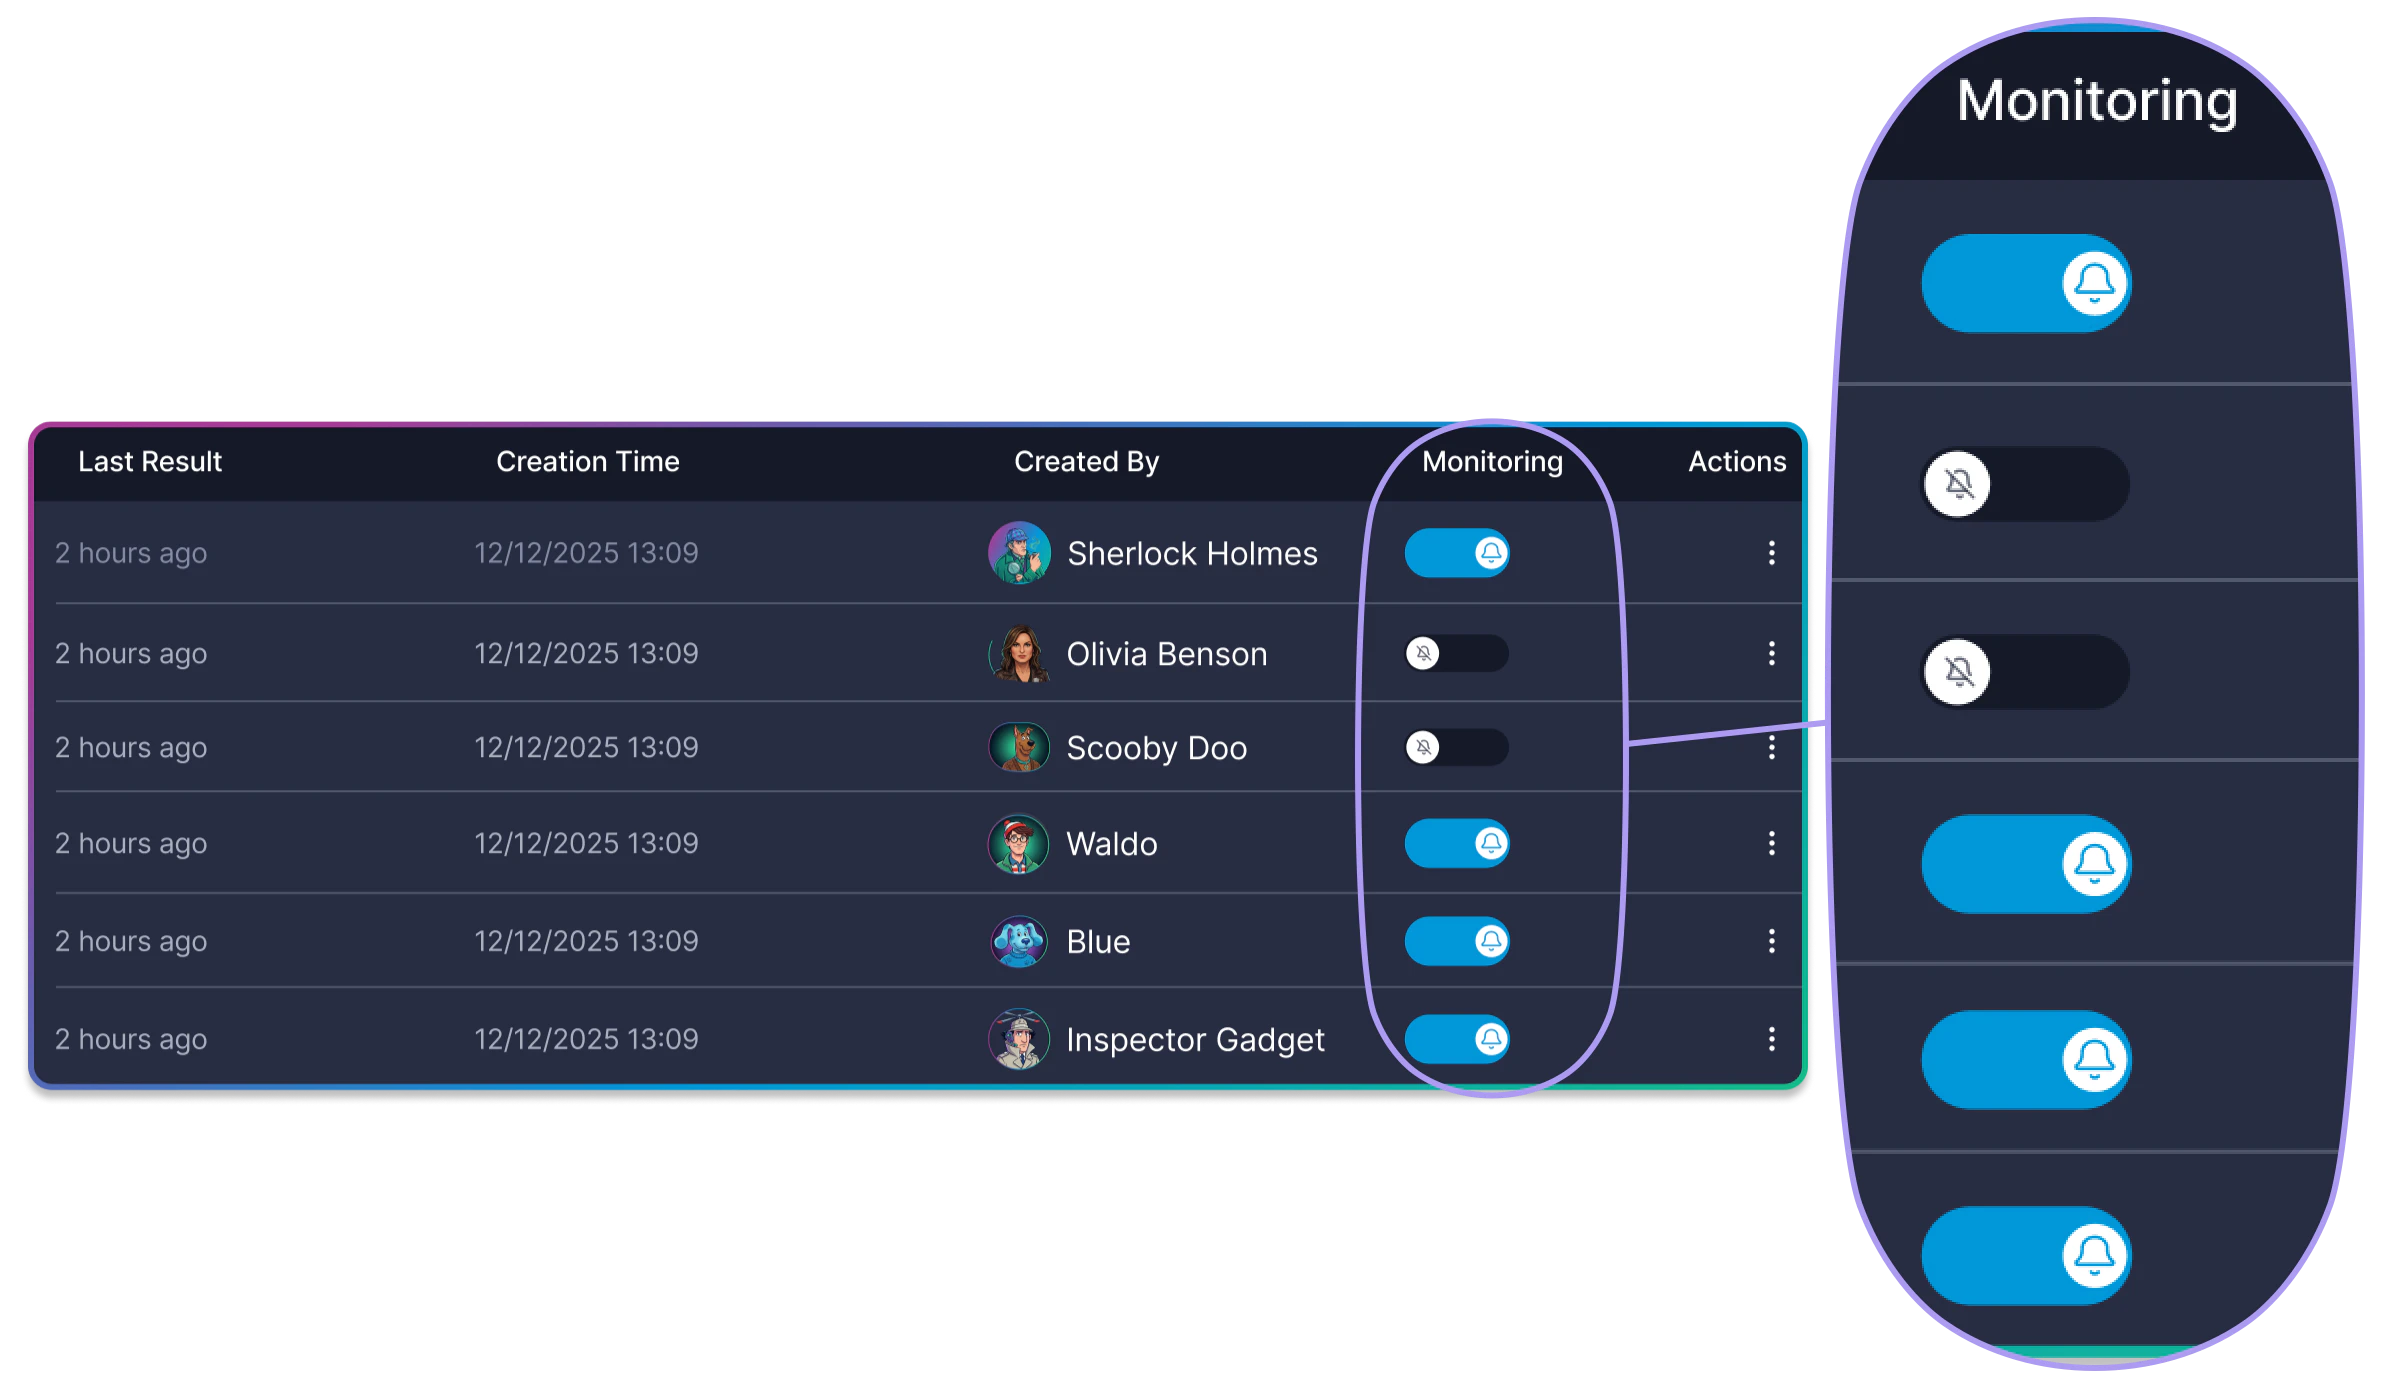
The monitoring toggle controls alert delivery only. Trend data collection continues regardless of the toggle state. Disabling alerts does not stop the system from tracking result counts.
Accessing Alerts
Alerts are accessible from the bell icon in the dataset header toolbar.Alert Badge
The bell icon displays a badge count indicating the number of unread alerts for the current dataset. The badge updates in real time as new alerts arrive. When all alerts are read, the badge disappears.Alert Panel
Click the bell icon to open the Monitor Alerts panel. The panel lists all alerts for the current dataset, with the most recent alerts at the top. Each alert entry displays the following information:Unread alerts appear with a highlighted background. Read alerts appear with a transparent background.
Managing Alerts
The Monitor Alerts panel provides basic alert management.Marking Alerts as Read
All alerts in the panel are automatically marked as read when the panel is closed. Open the panel, review your alerts, and close it to clear the unread count.Alert Scope
Alerts are scoped to the current dataset. Each dataset has its own independent alert stream. Switch between datasets to view alerts specific to each one.Alert Delivery
When a monitored view with alerting enabled detects new matching results, the system delivers an alert to all users with access to the dataset — not just the view creator. This includes users with direct access as well as users who have access through group membership.Alert delivery is event-driven and uses real-time streaming. The bell icon badge updates without requiring a page refresh.
Monitoring Without Alerts
Monitoring and alerting serve different purposes and can be used independently. Every saved view automatically collects trend data, building a history of how result counts change with each new data batch. This trend data is always available in the expanded view row, regardless of whether alerts are enabled. Use trend data without alerts when you want to:- Review data patterns retrospectively during scheduled analysis sessions.
- Compare result counts across multiple views to identify shifts in data composition.
- Track long-term trends without the interruption of per-batch notifications.
Related Resources
Saved Views
Create saved views with filter criteria that monitoring evaluates against incoming data.
Search and Filter
Build the filter combinations that drive your saved views and monitoring.
Add Media via API
Add new media to datasets, triggering monitoring evaluation on all views.
Task Manager
Track media addition and processing tasks that trigger monitoring evaluation.